5 Landsat Collection 2 SR & ST
5.1 Initialisms and Landsat Jargon
SR: surface reflectance product
ST: surface temperature product
Collection 2 (C2): The second version of the Landsat record - the transition to C2 began in 2020. There were extensive changes to the data storage and metadata when moving from Collection 1 to C2. An overview of the differences is available as a Portable Document Format (“PDF”) download here from the USGS. AquaSat v1 and LimnoSat-US were based on Collection 1 data, which are no longer available from the USGS and have been superseded by Collection 2 data.
Data Tier: a data tier for Landsat refers to data quality and processing. lakeSR uses Tier 1 data exclusively which conform to the highest level of data quality as defined by the geometric and radiometric quality, which indicates how much uncertainty is present in the pixel/scene location. To learn more about Landsat tiers, see this video from the USGS.
Data Processing Level (Level): a data processing level for Landsat refers to how much the data have been processed. Level 1 (top of atmosphere) is less processed than Level 2 (surface reflectance). lakeSR uses Level 2 data exclusively, as it has gone through standard atmospheric correction processes (see Section 5.3.1) that attempts to standardize data handling throughout the Landsat record - it is derived from Level 1 data. NASA has compiled a list of general data processing levels and descriptions here.
Landsat stack: this is the collated Landsat historical dataset at a specific location.
Matchup: a pair of observations, one from an in situ source, one from a remote sensing source. Matchups are often defined by a time window relative to the time of the in situ measurement, both before and after, as well as a spatial extent. In situ spatial extent is considered discrete, and the remote sensing extent is an aggregated value from a buffered area around that discrete in situ location.
5.2 Background Information
The information presented in this section originates from the NASA Landsat Science website and has been summarized here for the purpose of providing background information about the Landsat archive relevant to the creation and use of lakeSR.
The Landsat archive of multispectral and thermal data in lakeSR is composed of Landsat missions 4 through 9 and spans more than 40 years.
| Mission and Sensor | Launch Date | End of Science Mission | Decommission Date | Date Range Included in AquaMatch |
|---|---|---|---|---|
| Landsat 4 TM (Observation and Center 2020) | 1982-07-16 | 1993-12-14 | 2001-06-15 | Launch Date through End of Science Mission |
| Landsat 5 TM (Observation and Center 2020) | 1984-03-01 | 2011-11-18 | 2013-06-05 | Launch Date through End of Science Mission |
| Landsat 7 ETM+ (Earth Resources Observation and Science (EROS) Center 1999) | 1999-04-15 | 2022-04-06 | 2025-06-04 | 1999-05-28 through 2019-12-31 |
| Landsat 8 OLI/TIRS (Earth Resources Observation and Science (EROS) Center 2013) | 2013-02-11 | N/A | N/A | Launch Date through 2024-12-31 |
| Landsat 9 OLI-2/TIRS-2 (Earth Resources Observation and Science (EROS) Center 2013) | 2021-09-27 | N/A | N/A | Launch Date through 2024-12-31 |
The image record for Landsat 4 is not consistent nor robust due to a data transmitter failure early in service, however our pipeline acquires data as available. Landsat 6 did not achieve orbit.
For the purposes of AquaMatch, we truncate the data record for Landsat 4 and 5 at the end of the Science Mission of the satellite. No corrections were made for the Landsat 7 scanline error that began on May 31, 2003, data were collected as available despite the scanline error since the data are still of acceptable quality per the USGS. Additionally, Landsat 7 began to experience orbital drift beginning in 2017, resulting in top-of-atmosphere (and therefore also surface reflectance) values that had growing uncertainties over time as the drift increased (Qiu et al. 2021). Qui (2021) suggests that data are not robust enough for trend analysis after the start of the growing season in 2020, but because their analysis was of NDVI, we conservatively truncate the data at the end of 2019.
5.2.1 Band Value Ranges
While the nominal bands for each of the missions within the archive are relatively consistent (with the addition of an Aerosol band beginning Landsat 8 OLI/TIRS), the precise band range captured by the Landsat instruments for each nominal band shifted beginning with Landsat 8 OLI/TIRS. The image below visualizes how band ranges have shifted throughout the Landsat archive.
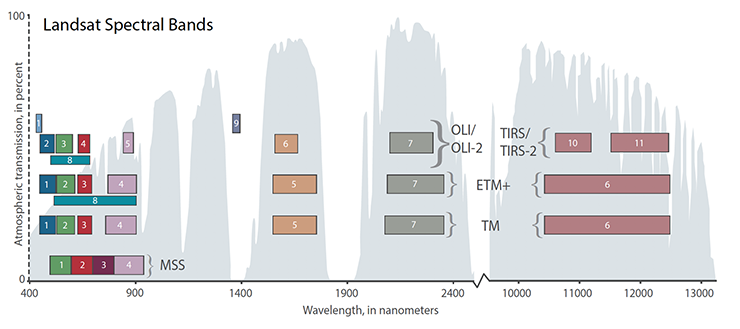
As depicted in the above figure, band designations have changed over time. The AquaMatch workflow automatically renames the band designation from a number (e.g. B1 (band 1), B2 (band 2), B3 (band 3), etc) to an assigned name (e.g. Blue, Green, Red, Landsat 4-7, but Aerosol, Blue, Green for Landsat 8/9) within the Google Earth Engine script and prior to exporting data for inclusion in this workflow. The table below denotes how these designations have been applied in AquaMatch.
| Band Label/Value | Landsat 4-7 Name | Landsat 8/9 Name |
|---|---|---|
| B1 | Blue | Aerosol |
| B2 | Green | Blue |
| B3 | Red | Green |
| B4 | Near Infrared “NIR” | Red |
| B5 | Shortwave Infrared 1 “SWIR1” | Near Infrared “NIR” |
| B6 | Thermal Band | Shortwave Infrared 1 “SWIR1” |
| B7 | Shortwave Infrared 2 “SWIR2” | Shortwave Infrared 2 “SWIR2” |
| B8 | Panchromatic band (not available for Landsat 4, not included in AquaMatch) | Panchromatic (not included in AquaMatch) |
| B9 | N/A | Cirrus (not included in AquaMatch |
| B10 | N/A | Thermal Band 1 |
| B11 | N/A | Thermal Band 2 (not included in AquaMatch) |
5.2.2 Sensor Resolution
The spatial resolution of the Level 1 data that the SR and ST products are derived from has not changed for optical bands over time (Aerosol, Red, Green, Blue, NIR, SWIR) but has varied over the historic record for thermal data:
| Sensors | Optical Bands | Thermal Bands |
|---|---|---|
| TM | 30 | 120 |
| ETM+ | 30 | 60 |
OLI/TIRS OLI-2/TIRS-2 |
30 | 100 |
All Collection 2 Level 2 Surface Reflectance and Surface Temperature data have been resampled to 30m.
Alongside the pixel resolution of the sensors is the radiometric resolution at which the data are stored. TM and ETM+ data are stored as 8-bit data products US Geological Survey (2020a), OLI data are quantized to 12 bits (US Geological Survey 2019) and Landsat 9 to 14 bits (US Geological Survey 2022). This equates to 256 shades per band for Landsat 4-7 (28), 4,096 shades for Landsat 8 (212) and 16,384 shades for Landsat 9 (214), where higher numbers allow for greater precision of measurement in a given band. All Collection 2 Level 2 Surface Reflectance and Surface Temperature data have been rescaled and stored as unsigned 16 bit values (range for SR and ST bands are are 65536 shades, or 216). Since Collection 2 rescaling to a higher number of bits creates false precision across all satellites, we truncate the surface reflectance values to three significant digits for Landsat 4 - 7, four digits for Landsat 8, and five digits for Landsat 9.
5.3 Surface Reflectance Product
The information presented in this section originates from the USGS Landsat Collection 2 Surface Reflectance product page and has been summarized here for the purpose of providing background information about the Landsat archive relevant to the creation and use of lakeSR and siteSR products.
The Landsat C2 SR product is a Level 2 data product that has been atmospherically corrected from the Level 1 Top of Atmosphere product using a myriad of inputs to create a reasonably consistent data product across space and time. The USGS Earth Resources Observation and Science (EROS) Center describes the SR product as follows:
Surface reflectance improves comparison between multiple images over the same region by accounting for atmospheric effects such as aerosol scattering and thin clouds, which can help in the detection and characterization of Earth surface change. Surface reflectance is generated from Level-1 inputs that meet the <76 degrees Solar Zenith Angle constraint and include the required auxiliary data inputs to generate a scientifically viable product.
5.3.1 SR Atmospheric Processing
The SR product for Landsat 4-7 is calculated using the Land Ecosystem Disturbance Adaptive Processing System (LEDAPS) (Schmidt et al. 2013) and Landsat 8 and 9 SR data are calculated using the Land Surface Reflectance Code (LaSRC) algorithm (Vermote et al. 2016). The two algorithms are functionally different, but the outcome is the same: a consistently-processed surface reflectance product that is available worldwide. See the table under section heading ‘Differences in Surface Reflectance Processing Algorithms’ on the USGS Landsat C2 website for details.
5.4 Surface Temperature
The information presented in this section originates from the USGS Landsat Collection 2 Surface Temperature product page and has been summarized here for the purpose of providing background information about the Landsat archive relevant to the creation and use of lakeSR and siteSR products.
The Landsat Collection 2 Surface Temperature product is calculated using a single-channel algorithm (Cook et al. 2014) to convert the thermal band data to temperature estimates in degrees Kelvin. While these data are considered interoperable over space and time with few differences in the ST algorithm product within Collection 2, there do appear to be slight differences in the ST product between sensors. Like with the surface reflectance product, we calculate between-mission handoffs for the TM/ETM+/TIRS products in Section 8.
It is important to note that the thermal band spatial resolution is coarser than the optical bands in all Landsat missions (see Section 5.2.2). At this time we do not account for mixed thermal pixel boundaries due to the difference in pixel resolution between optical and thermal sensors in lakeSR or siteSR outside of the flags described in Section 3.1.4 and Section 3.2.2. Additional data handling may be necessary to use these data as precise estimates of water surface temperature given these constraints.
We do provide surface temperature summary statistics in the siteSR product as
well, and users should approach the data with caution when a WQP monitoring site
is near to a shoreline. While we do not have explicit guidance for the use of
the surface temperature estimates for siteSR, we do provide some characteristics
of sites and their relationships to NHD flowlines and waterbodies (see Section
3.2.2 additional descriptors). Users could use a combination
of MonitoringLocationTypeName, the flags assigned from our NHD assignment
process, and the distance columns from that process to assess whether or not the
temperature data is appropriate for a given site. Additional assessments may be
necessary to assess whether it is appropriate to use the temperature data for
discrete analysis of temperature trends/patterns. King et al. (2025) noted that handoff
coefficients should be used for the surface temperature product as well, see
Section 8 for details.